If you’ve ever sat around waiting for a stuck CI build that never finishes, eating up runner resources and delaying your team’s whole deployment schedule, you know how destructive unexpected deadlocks can be. Most teams spend all their time trying to avoid deadlocks, but there’s a lot of value in triggering them on purpose in a controlled environment. Learning how to make builds deadlock intentionally lets you test your detection and recovery workflows before a random deadlock hits your production pipeline and costs your team hours of wasted work.
Core Preconditions You Need to Trigger a Build Deadlock
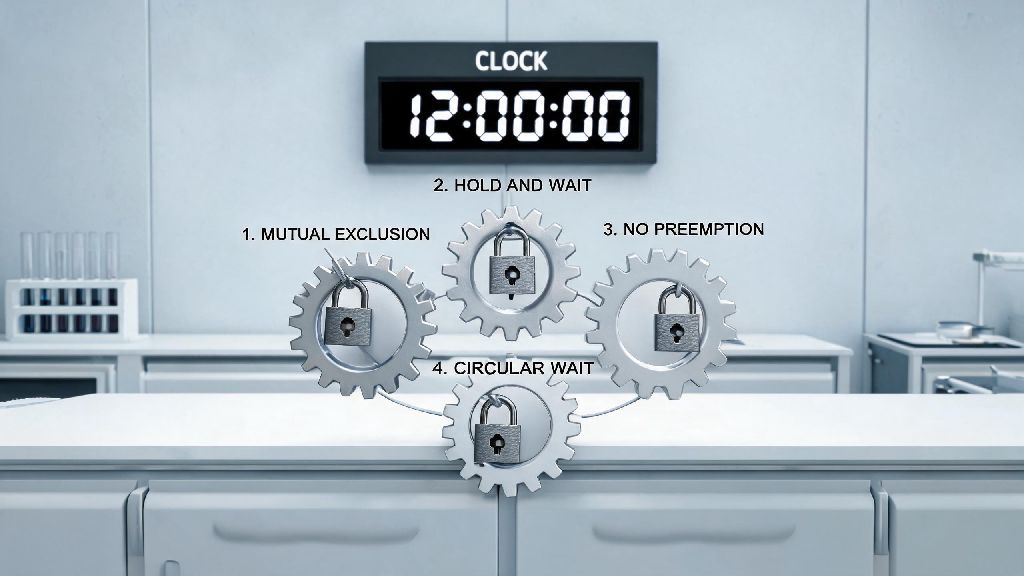
Deadlocks don’t happen randomly—they only occur when four specific conditions are met at the same time, called the Coffman conditions. You don’t need a computer science degree to understand them, and you’ll need to intentionally set all four up to create a test deadlock in your builds. Mutual exclusion means at least one resource is locked so only one process can use it at a time; for builds, this is often a dependency cache, test database slot, or shared storage directory. Hold and wait means a process is holding one locked resource while waiting for access to a second resource controlled by another process.
The third condition is no preemption, which means the system can’t force a process to release a resource it’s already locked—you have to wait for the process to release it voluntarily, which a deadlocked process never will. The final condition is circular wait, where two or more processes form a loop, each waiting for a resource held by the next process in the loop. If any one of these four conditions is missing, a deadlock can’t form, so you’ll need to make sure all four are present in your test setup.
How to Make Builds Deadlock Intentionally for Testing
Before you start, make sure you’re using a completely isolated test CI environment, not shared production runners. A test deadlock can easily spiral out of control if it locks shared resources, and you don’t want to accidentally delay real deployments for your team. You’ll need a few key tools to run the test safely:
Once you have all these set up, modify the first build job to request a lock on the npm cache first, wait 10 seconds, then request a lock on the test database port. Modify the second job to request the test database port lock first, wait 10 seconds, then request the npm cache lock. Schedule both jobs to run at exactly the same time. You should never leave this test running unsupervised, even in a staging environment, as deadlocked jobs can eat up disk space and memory over time if left unaddressed.
After a few seconds, you’ll see both jobs stop generating new log output, and your runner resource monitor will show both processes using 0% CPU, even though they’re still marked as running. That’s your deadlock: both jobs hold one resource, are waiting for the other, and neither will ever release their held lock voluntarily. You can verify the locks using built-in OS tools like lsof for file locks or ss for port locks to confirm both resources are held by separate job processes.
Key Metrics to Record During Your Deadlock Test
Triggering the deadlock is only half the point of this exercise. The real value comes from collecting data about how your CI system responds, so you can fix gaps before a real deadlock hits. The first metric to track is time to detection: how long does it take your monitoring system to flag that the builds are stuck and potentially deadlocked? Most teams set a baseline of 10 to 15 minutes for this, as normal builds can have short periods of low log output when running large test suites.
Next, track recovery success rate: does your system automatically cancel the deadlocked jobs and release all locked resources, or do you have to manually intervene to kill the processes and clear the locks? If your system is supposed to auto-recover, note how many resources are left locked after the auto-recovery runs, and how long it takes for the runner to be available for new jobs. You should also track how many other test jobs get queued behind the deadlocked builds, to understand the real world impact a similar deadlock would have on your team’s workflow.
For example, when my team ran this test last quarter, we found our monitoring system took 47 minutes to flag our test deadlock, which was way over our 15 minute SLA. We also found that our auto-recovery script only cleared file locks, not port locks, so the runner was unusable until we manually logged in and cleared the stuck port. We fixed both issues within a week, and a month later, a real deadlock hit our production runners, and the system resolved it in 12 minutes with no manual intervention required. That’s the exact payoff you get from running these tests.
Common Mistakes to Avoid When Creating Test Build Deadlocks
It’s easy to make small mistakes that either prevent your test deadlock from forming, or cause unintended damage to your test environment. The biggest mistake by far is running these tests on shared production or staging runners. Even if you think your jobs are isolated, you might accidentally lock a shared resource like a team-wide dependency cache, which will cause deadlocks for every other build running on that runner cluster. Always use a completely isolated, single-use runner for deadlock testing that you can wipe clean immediately after the test is done.
Another common mistake is forgetting to disable your default auto-cancel rules before running the test. If your system automatically cancels any job that runs longer than 20 minutes, you won’t have time to test your detection workflows, and you won’t be able to observe the full deadlock state. Just remember to turn those auto-cancel rules back on after the test, so you don’t leave any stray jobs running by accident.
You also don’t want to only test one deadlock scenario. Builds can deadlock for dozens of reasons beyond just cache and port locks: shared file storage, network resource limits, external API rate locks, and even concurrent test database migrations can all trigger deadlocks in real world use. Test a few different scenarios to make sure your detection and recovery tools cover all the most common deadlock causes for your specific stack.
Finally, don’t forget to run a full resource cleanup after every test. Even if you cancel the deadlocked jobs manually, some locks might persist, especially if you’re using networked storage or external database resources. A quick cleanup script that kills all leftover job processes, clears all file and port locks, and resets any test databases you used will save you from headaches with future tests on the same runner.
Learning how to make builds deadlock intentionally might seem counterintuitive when most of your work is focused on keeping builds running smoothly, but it’s one of the most effective ways to harden your CI/CD pipeline against unexpected outages. Taking a few hours to run controlled deadlock tests every quarter will save your team dozens of hours of debugging stuck builds, reduce deployment delays, and make your whole development workflow far more resilient. Start small with a single isolated runner and a simple two-job test, and you’ll be surprised how many hidden gaps in your monitoring and recovery workflows you can find and fix before they cause real problems for your team.